Chrome Requests Response Headers
Know How to find the Requests Response Headers in Chrome
Sometimes QA needs to debug the HTTPd request the browser is making. This is usually to make sure some conditions are met or to figure out why something isn't working.
In Google Chrome this is pretty simple task.

Finding the HTTP Header
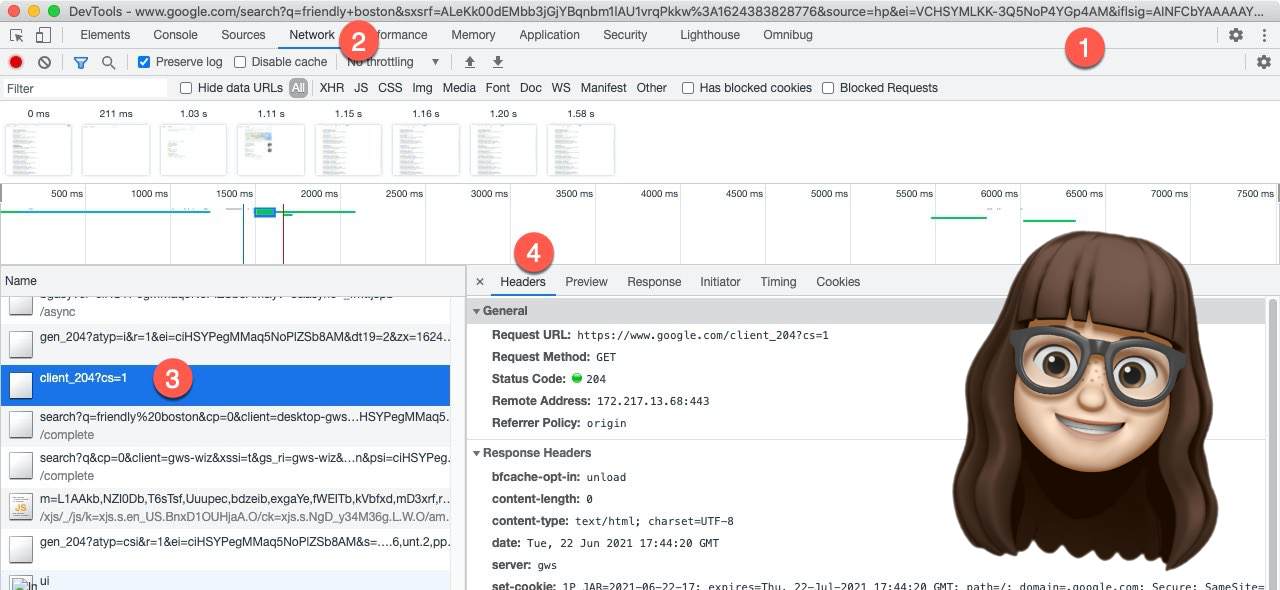
- Right click on the page and select Inspect (Or type in Option Command I)
- Select the Network tab on the top of the DevTools page and then reload the page (Command R)
- Select any Name (These are the various request that were made during the page load time.)
- On the right, select the Header tab
This is where you'll see the request and response between your browser and the server. There's a lot going on here!
You should be able to get a lot of data that may help troubleshoot any issues.
Why Should QA Know This?
QA should have the knowledge of all the tools in the browser toolbox. Debugging JavaScript, jQuery and Angular isn't enough. Sometimes, as part of validation, QA may need to read the HTTP Request Headers and verify that the browser is sending the correct information.
You can learn more about HTTP Requests Response Headers from DumbTutorials. It's a good place to catch up on everything HTTP.
